Vector / AI
BetterDB Monitor’s Vector / AI tab gives you a single view of vector-index health and FT.SEARCH workload on any Valkey or Redis instance that has the Search module loaded. It’s built for teams running semantic search, retrieval-augmented generation, or any pipeline where the vector index is the hot path.
Requirements
The tab appears automatically when the connected database exposes the Search module:
- Redis 8.0+ — RediSearch is bundled by default
- Valkey 8 with
valkey-search— module loaded at startup - Managed services — any offering that keeps
FT._LIST,FT.INFO,FT.SEARCHavailable
If the module isn’t loaded (or the command is restricted), the tab hides from the sidebar and the direct URL shows an explanatory overlay. See Unavailable state.
The dashboard at a glance
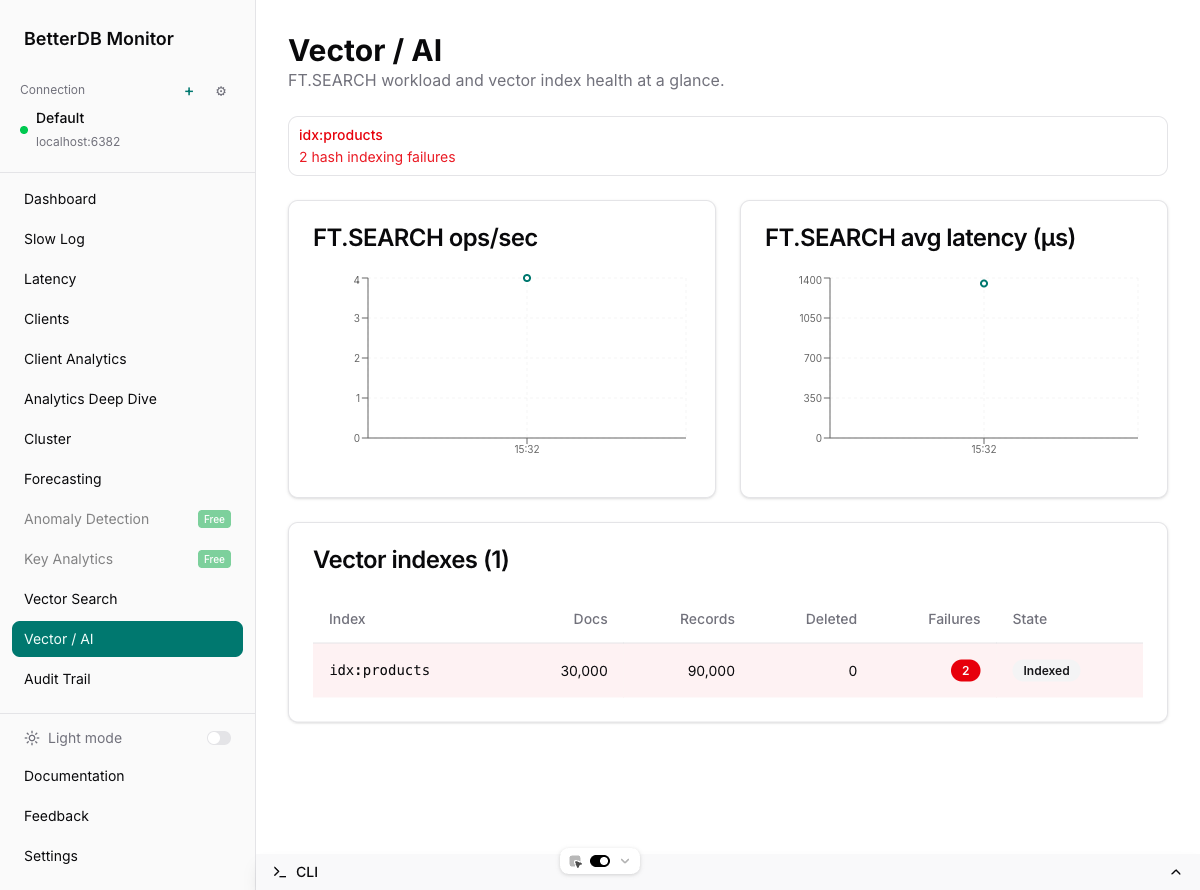
Four regions, top to bottom:
- Header — feature title and one-liner
- Health alerts — only rendered when at least one condition is true; otherwise it’s absent
- FT.SEARCH ops/sec and avg latency charts — rolling 1-hour window, refreshes every 15 s
- Vector indexes table — one row per index on the current connection, refreshes every 30 s
Health alerts
Surfaces three classes of problem per index:
| Condition | Alert text | When it fires |
|---|---|---|
indexingFailures > 0 | <index> — N hash indexing failure(s) | The cumulative count of docs the server rejected because their indexed field didn’t match the schema (e.g. a 9-byte string where a 128-float vector was expected) |
indexingState != 'indexed' and percentIndexed < 100 | <index> — Backfilling — XX.X% indexed | An index is still catching up on its prefix — present during initial backfill and after any operation that invalidates the index |
numDeletedDocs > 0 | <index> — N deleted docs accumulating | Tombstones from partial or failed in-place updates; a non-zero value hints at wasted memory until the index is compacted |
Any non-zero alert uses the destructive variant so it stands out against the rest of the page.
The charts
Both charts consume /metrics/commandstats/ft.search/history, which stores per-poll deltas of Valkey’s INFO commandstats section:
- ops/sec =
callsDelta / (intervalMs / 1000) - avg latency (µs) =
usecDelta / max(callsDelta, 1)
Delta sampling means:
- The first poll writes nothing (baseline only) — on a freshly started API you’ll see a short “Waiting for samples” message until the second poll lands
- Zero-delta samples are dropped, so the chart is free of flat idle points
CONFIG RESETSTATis detected (current counter < previous) and triggers a re-baseline without writing a bogus negative sample
The index table
Each row reports the live state from FT.INFO plus a few persisted fields:
| Column | Source | Notes |
|---|---|---|
| Index | name | Monospaced so long names don’t wrap awkwardly |
| Docs | num_docs | Docs currently addressable by FT.SEARCH |
| Records | num_records | Underlying records (typically docs × indexed fields) |
| Deleted | num_deleted_docs | Tombstones from in-place updates; RediSearch-specific, reports 0 on valkey-search |
| Failures | hash_indexing_failures | Red destructive Badge when non-zero; pink row tint |
| State | indexingState + percentIndexed | Indexed secondary Badge when settled, brand-colored Indexing… XX% Badge while backfilling |
Indexing in progress
When a new index is created over an existing prefix, the row shows the backfill progress live:
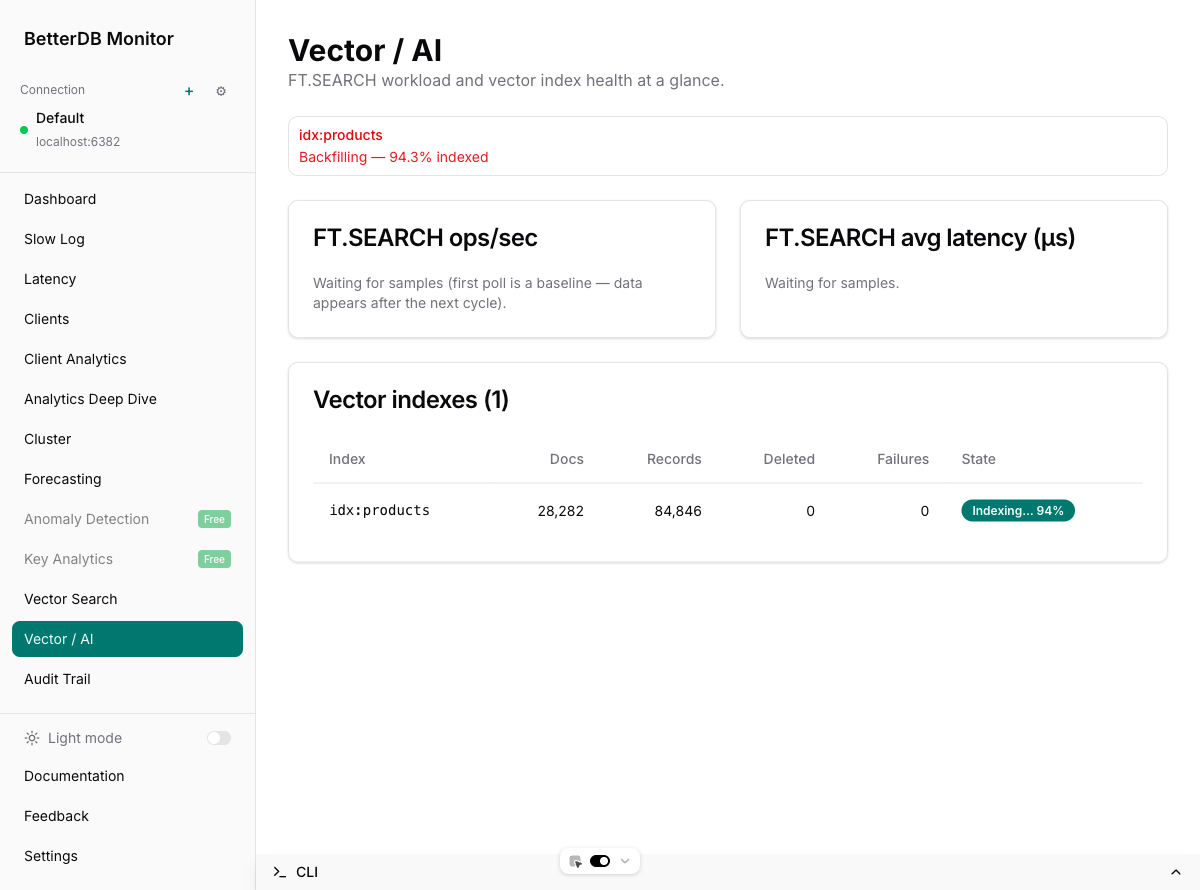
Creating an HNSW index over 30,000 128-dim vectors above took about 21 s on a dev machine. Both the alert strip and the badge flip to the settled Indexed state once percent_indexed reaches 1.0.
Unavailable state
On a database without the Search module, the sidebar hides both the Vector Search and Vector / AI links and the direct URL renders an explanatory overlay:
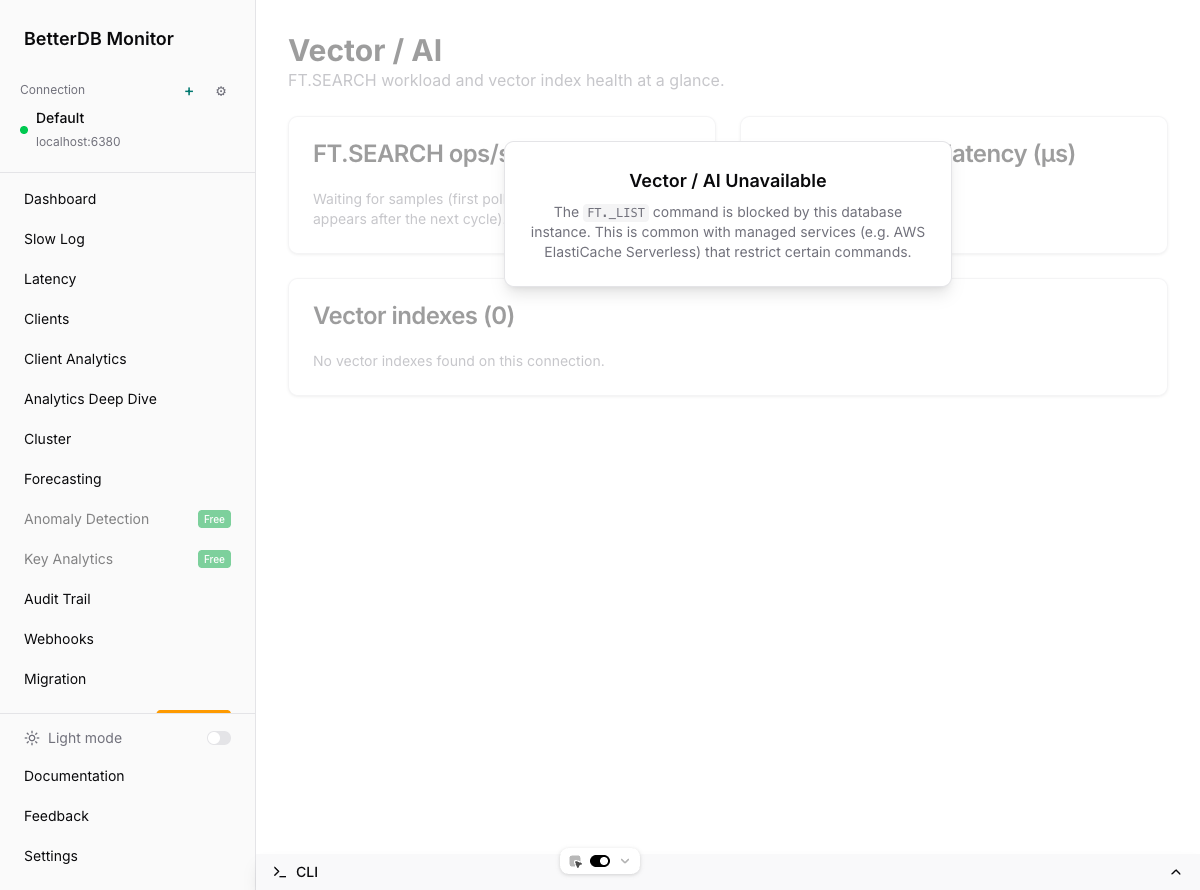
The wording covers both realistic causes: the module isn’t loaded on a plain Valkey or Redis build, or FT._LIST is restricted by a managed service like AWS ElastiCache Serverless.
Under the hood
The tab is a thin consumer of three backend pieces:
| Concern | Endpoint | Poller |
|---|---|---|
| Index list | GET /vector-search/indexes | VectorSearchService, 30 s |
| Per-index live info | GET /vector-search/indexes/:name | Same |
| Historical snapshots | GET /vector-search/indexes/:name/snapshots | Persisted to vector_index_snapshots every 30 s, retained 7 days |
| Command workload | GET /metrics/commandstats/:command/history | CommandstatsPollerService, 15 s, persisted to command_stats_samples, retained 7 days |
Prometheus scraping is supported via /prometheus/metrics with these gauges, labelled by connection and index:
betterdb_vector_index_docsbetterdb_vector_index_memory_bytesbetterdb_vector_index_indexing_failuresbetterdb_vector_index_percent_indexed
Stale labels are pruned when an index disappears between polls, so dropped indexes stop reporting automatically.
Troubleshooting
The tab is missing from the sidebar. The current connection doesn’t expose FT._LIST. Confirm with MODULE LIST or FT._LIST on the server. If you’re on managed Redis/Valkey, check whether the provider restricts FT.*.
Charts stay on “Waiting for samples” for longer than a minute. The commandstats poller runs every 15 s but the first poll is always a baseline. If there’s still nothing after the second cycle, confirm the Valkey/Redis instance is actually serving FT.SEARCH traffic — zero-delta commands are dropped by design. Also confirm CommandstatsPollerService is wired up in your deployment (pnpm dev or production image).
A Failures badge shows a non-zero count. That’s the raw hash_indexing_failures counter. Check recent application writes targeting that index’s prefix — the usual cause is a schema mismatch (vector bytes of the wrong length, non-numeric value in a NUMERIC field, etc.). The counter never resets until the index is dropped and recreated, so fix the offending writer first, then FT.DROPINDEX + re-FT.CREATE to clear it.
Indexing progress seems stuck. If percent_indexed isn’t moving across multiple polls, the server may be rate-limited on indexing (large key count, large vector dimension, constrained CPU). Inspect FT.INFO <index> directly — look at indexing_failures and, on RediSearch, gc_stats.